Dashboard
The Dashboard page provides a comprehensive and detailed view of the usage and costs of artificial intelligence services on the platform. It is an essential tool for monitoring and managing resource consumption. The reports on the dashboard are displayed per month. You can navigate to previous months using the month selector in the top right corner of the page.
Costs
The Costs section presents charts that show the total accumulated costs throughout the month. These charts help identify consumption trends and plan future resource usage.
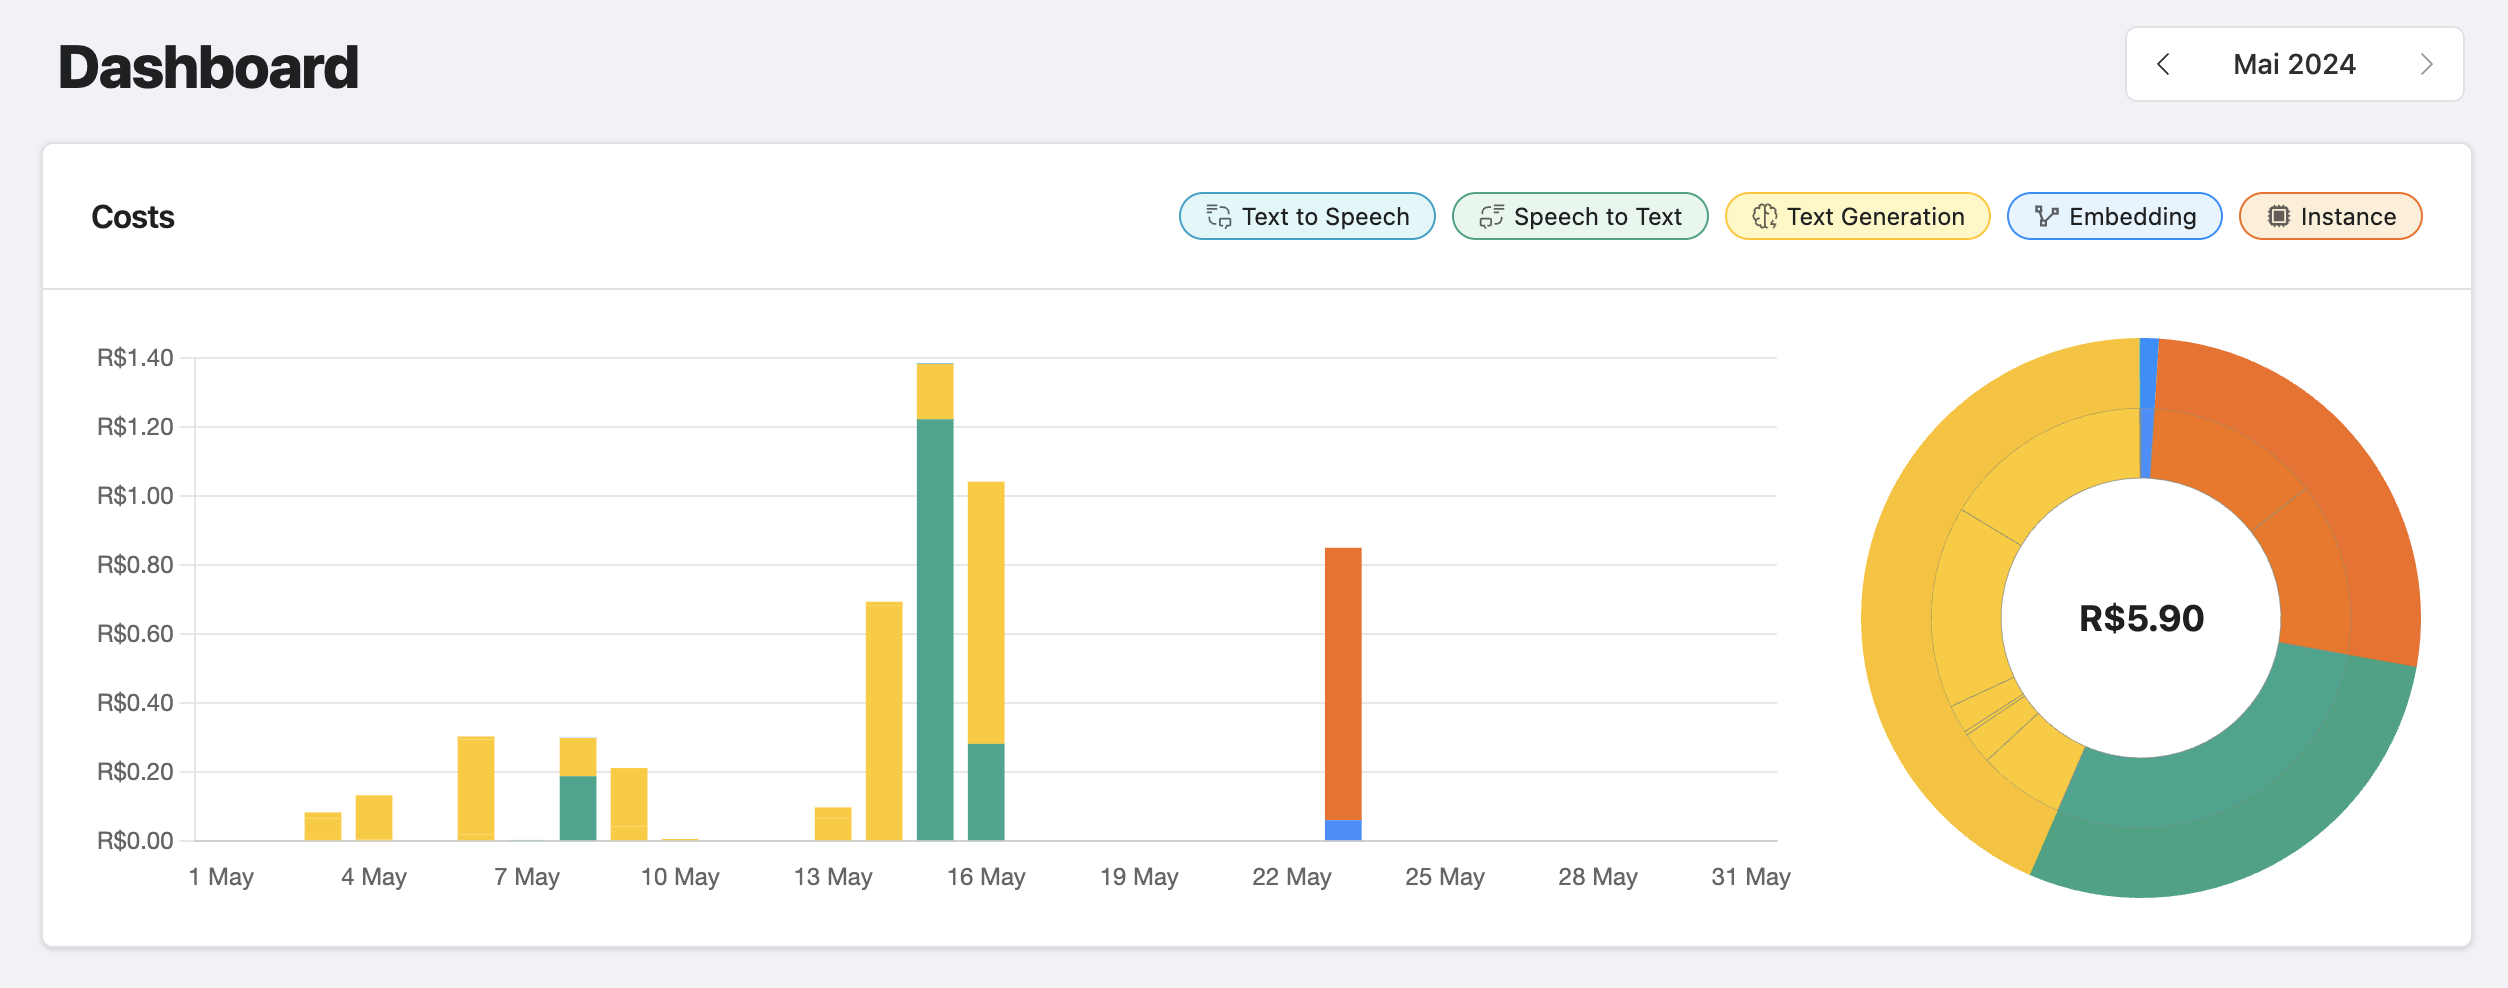
- Bar Chart: Displays the accumulated daily costs throughout the month, allowing for a detailed analysis of when and how resources are consumed.
- Pie Chart: Shows the accumulated distribution of costs throughout the month, providing an overview of each service's contribution to the total costs.
Customizing Charts
You can customize the charts to show specific information:
- Click on the service names (such as
Text to Speech,Speech to Text, etc.) above the charts to add or remove their respective information. - Colors help differentiate each cost type, facilitating personalized visualization.
Usage by Model
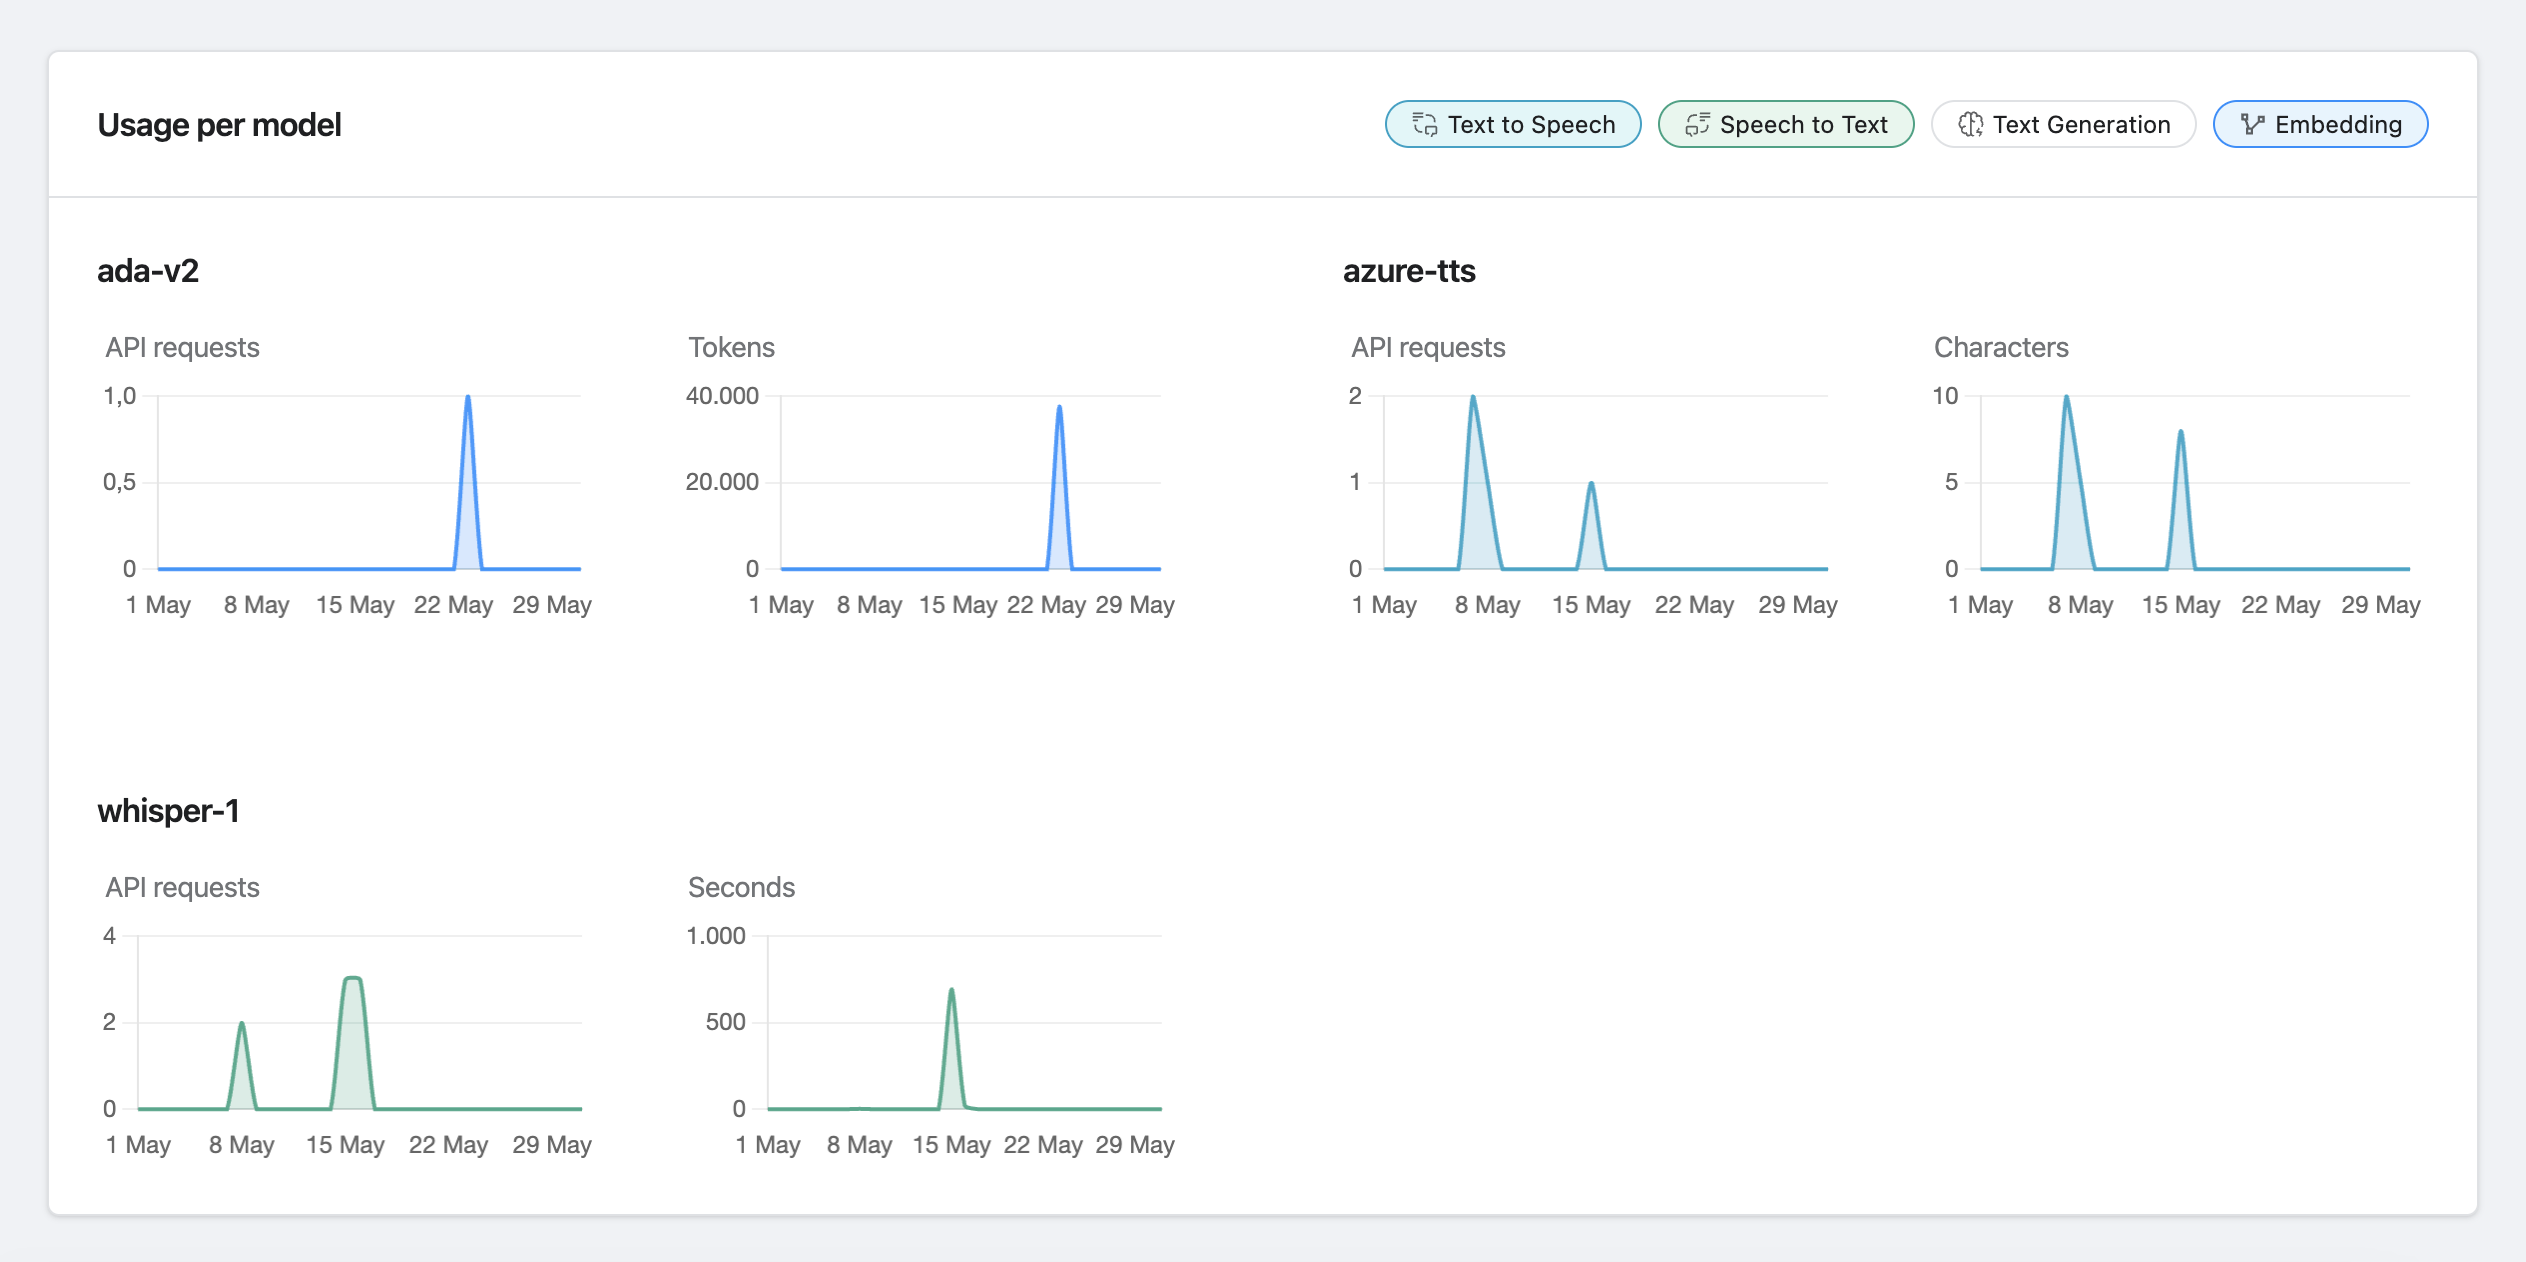
This section details the usage of different AI models available on the platform. Each model has individual charts that show:
- API Requests: Number of API calls made to the model.
- Tokens/Characters/Seconds: Amount of resources consumed by the model, varying depending on the service type.
Note
The usage by model charts have different scales for the Y-axis. This is done to ensure that usage variations are clearly visible, but it prevents direct comparisons between different models.
Usage by Instance
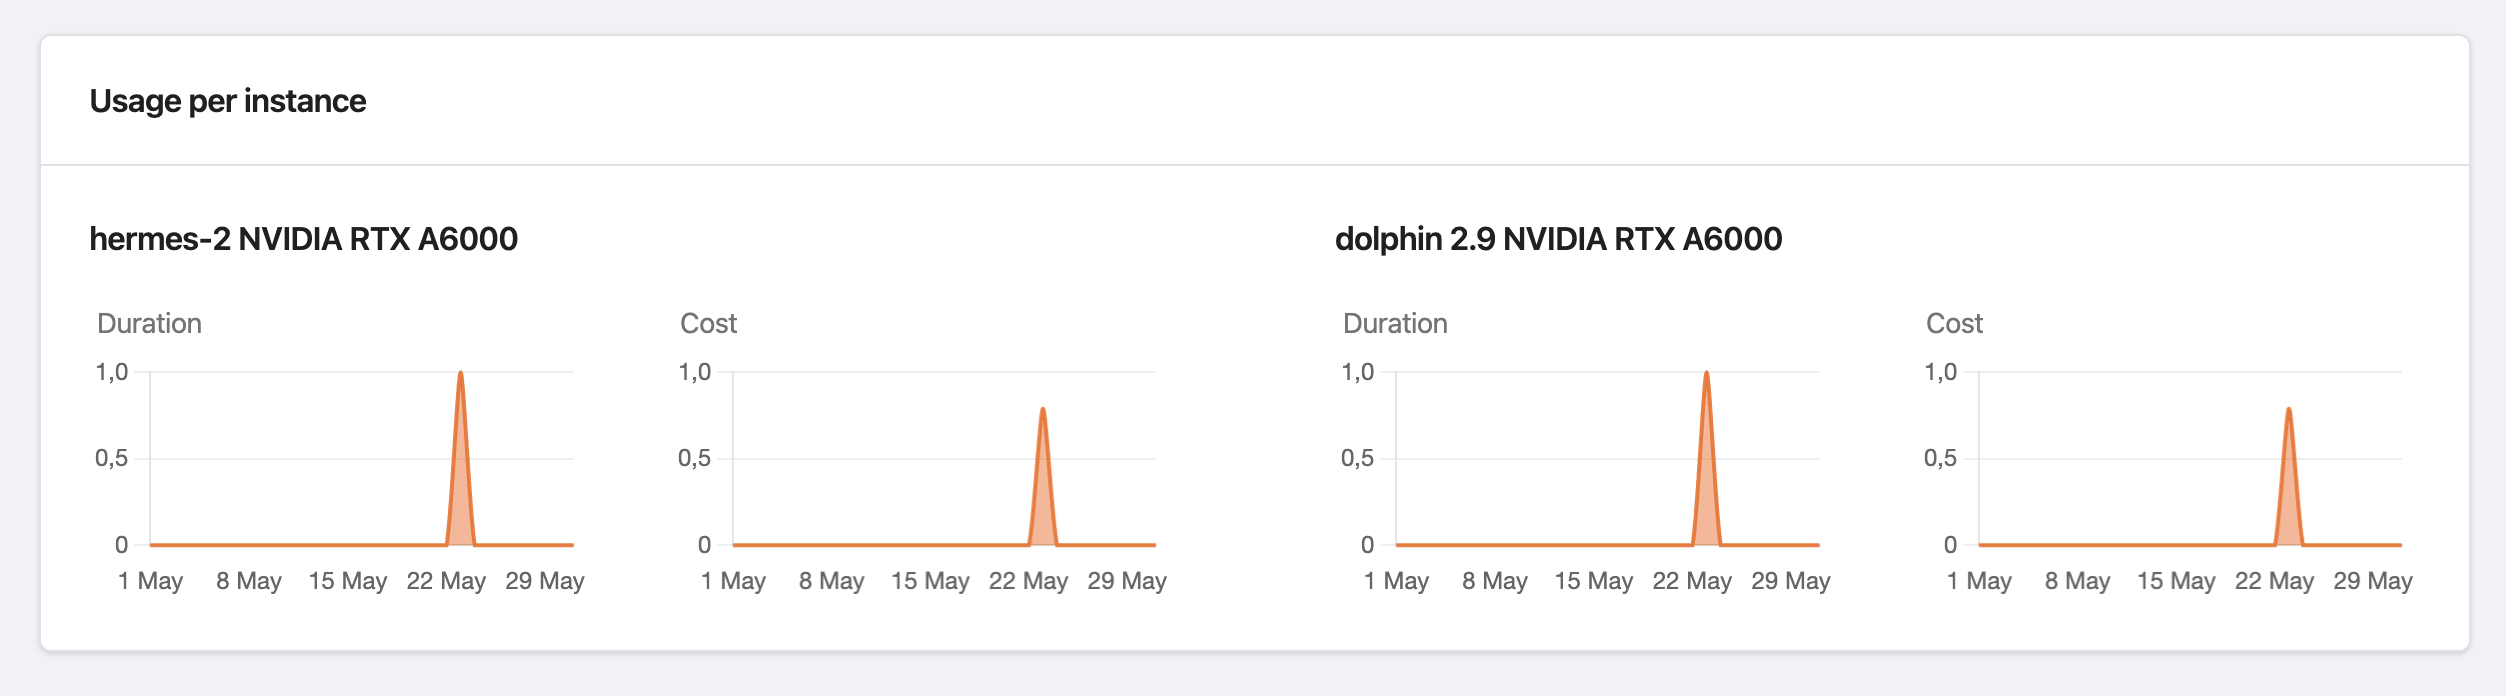
Here you can view the usage of rented machine instances for running specific models. The charts in this section show:
- Duration: Total usage time of the instance.
- Cost: Accumulated cost for using the instance.
Note
Just like in the usage by model charts, the usage by instance charts also have different scales for the Y-axis, ensuring clarity of usage and cost variations, but preventing direct comparisons between different instances.
Detailed Usage Table
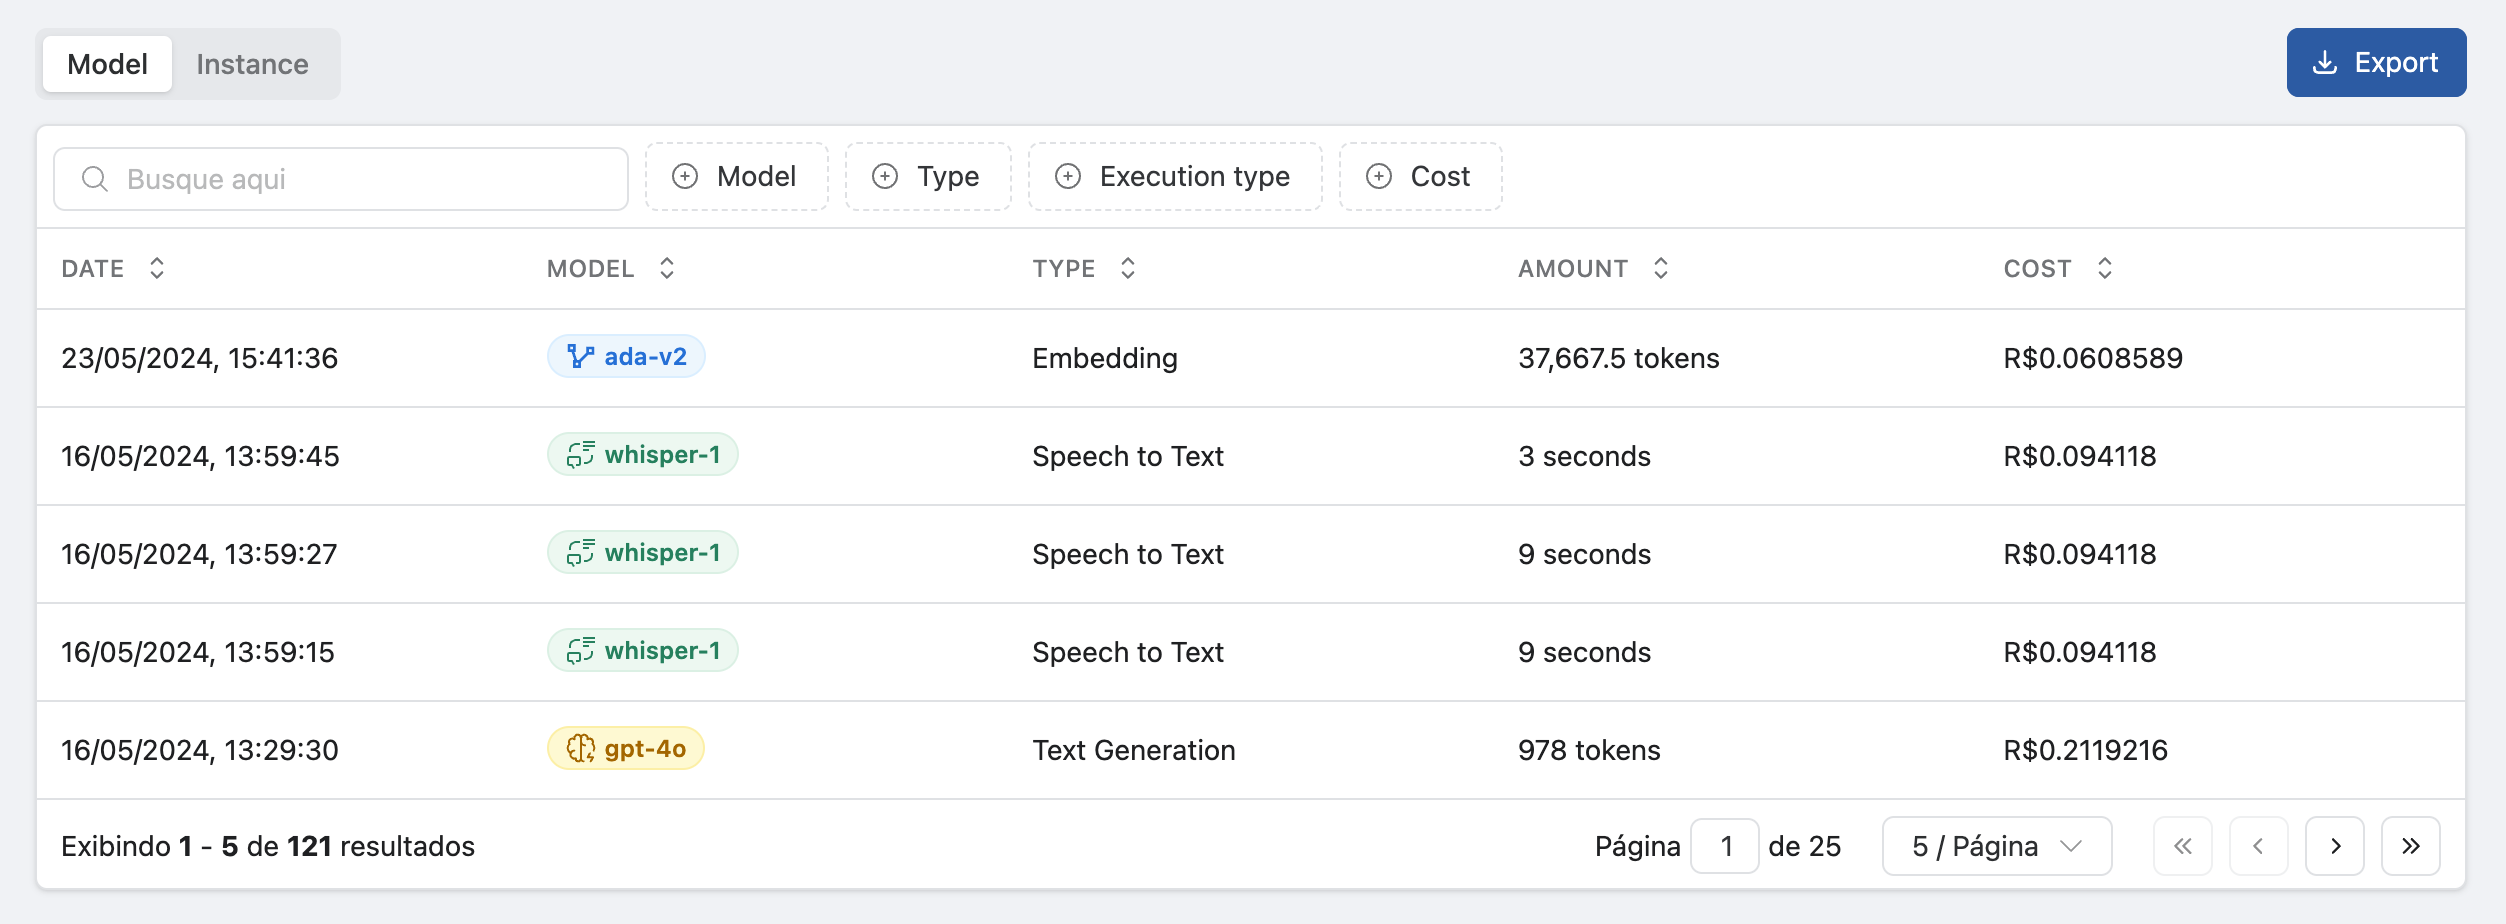
The table at the bottom of the dashboard provides a complete breakdown of all recent activities on the platform, including:
- Date and Time: When the activity occurred.
- Model: Which AI model was used.
- Type: Type of service performed (e.g.,
Embedding,Speech to Text,Text to Speech,Text Generation). - Execution Type: Specific details of the execution type.
- Quantity: Amount of resources consumed (e.g., tokens, seconds).
- Cost: Cost associated with each activity.
Switching Between Tables
You can switch between viewing the usage table by model and by instance by clicking on the respective tabs (Model and Instance).
Data Export
You can export the usage data for external analysis:
- Access Export: Click on the
Exportbutton in the top right corner of the detailed usage table. - Select Export Options:
- Table Type: Choose between
ModelorInstance. - Format: Choose the file format,
CSVorJSON. - Period: Select the desired period for export (maximum of 180 days).
- Table Type: Choose between
Filters and Search
The detailed usage table has filter and search options to facilitate finding specific information:
- Filter by Model: Allows filtering activities by AI model.
- Filter by Type: Allows filtering activities by service type.
- Filter by Execution Type: Allows filtering activities by execution type.
- Filter by Cost: Allows filtering activities by cost range.
Using the Dashboard
The dashboard is an essential tool for managing resource usage and controlling costs on the platform. Use the charts to monitor daily and monthly usage, identify models that are consuming the most resources, and adjust your usage strategies as needed to optimize costs and efficiency.