Dashboard
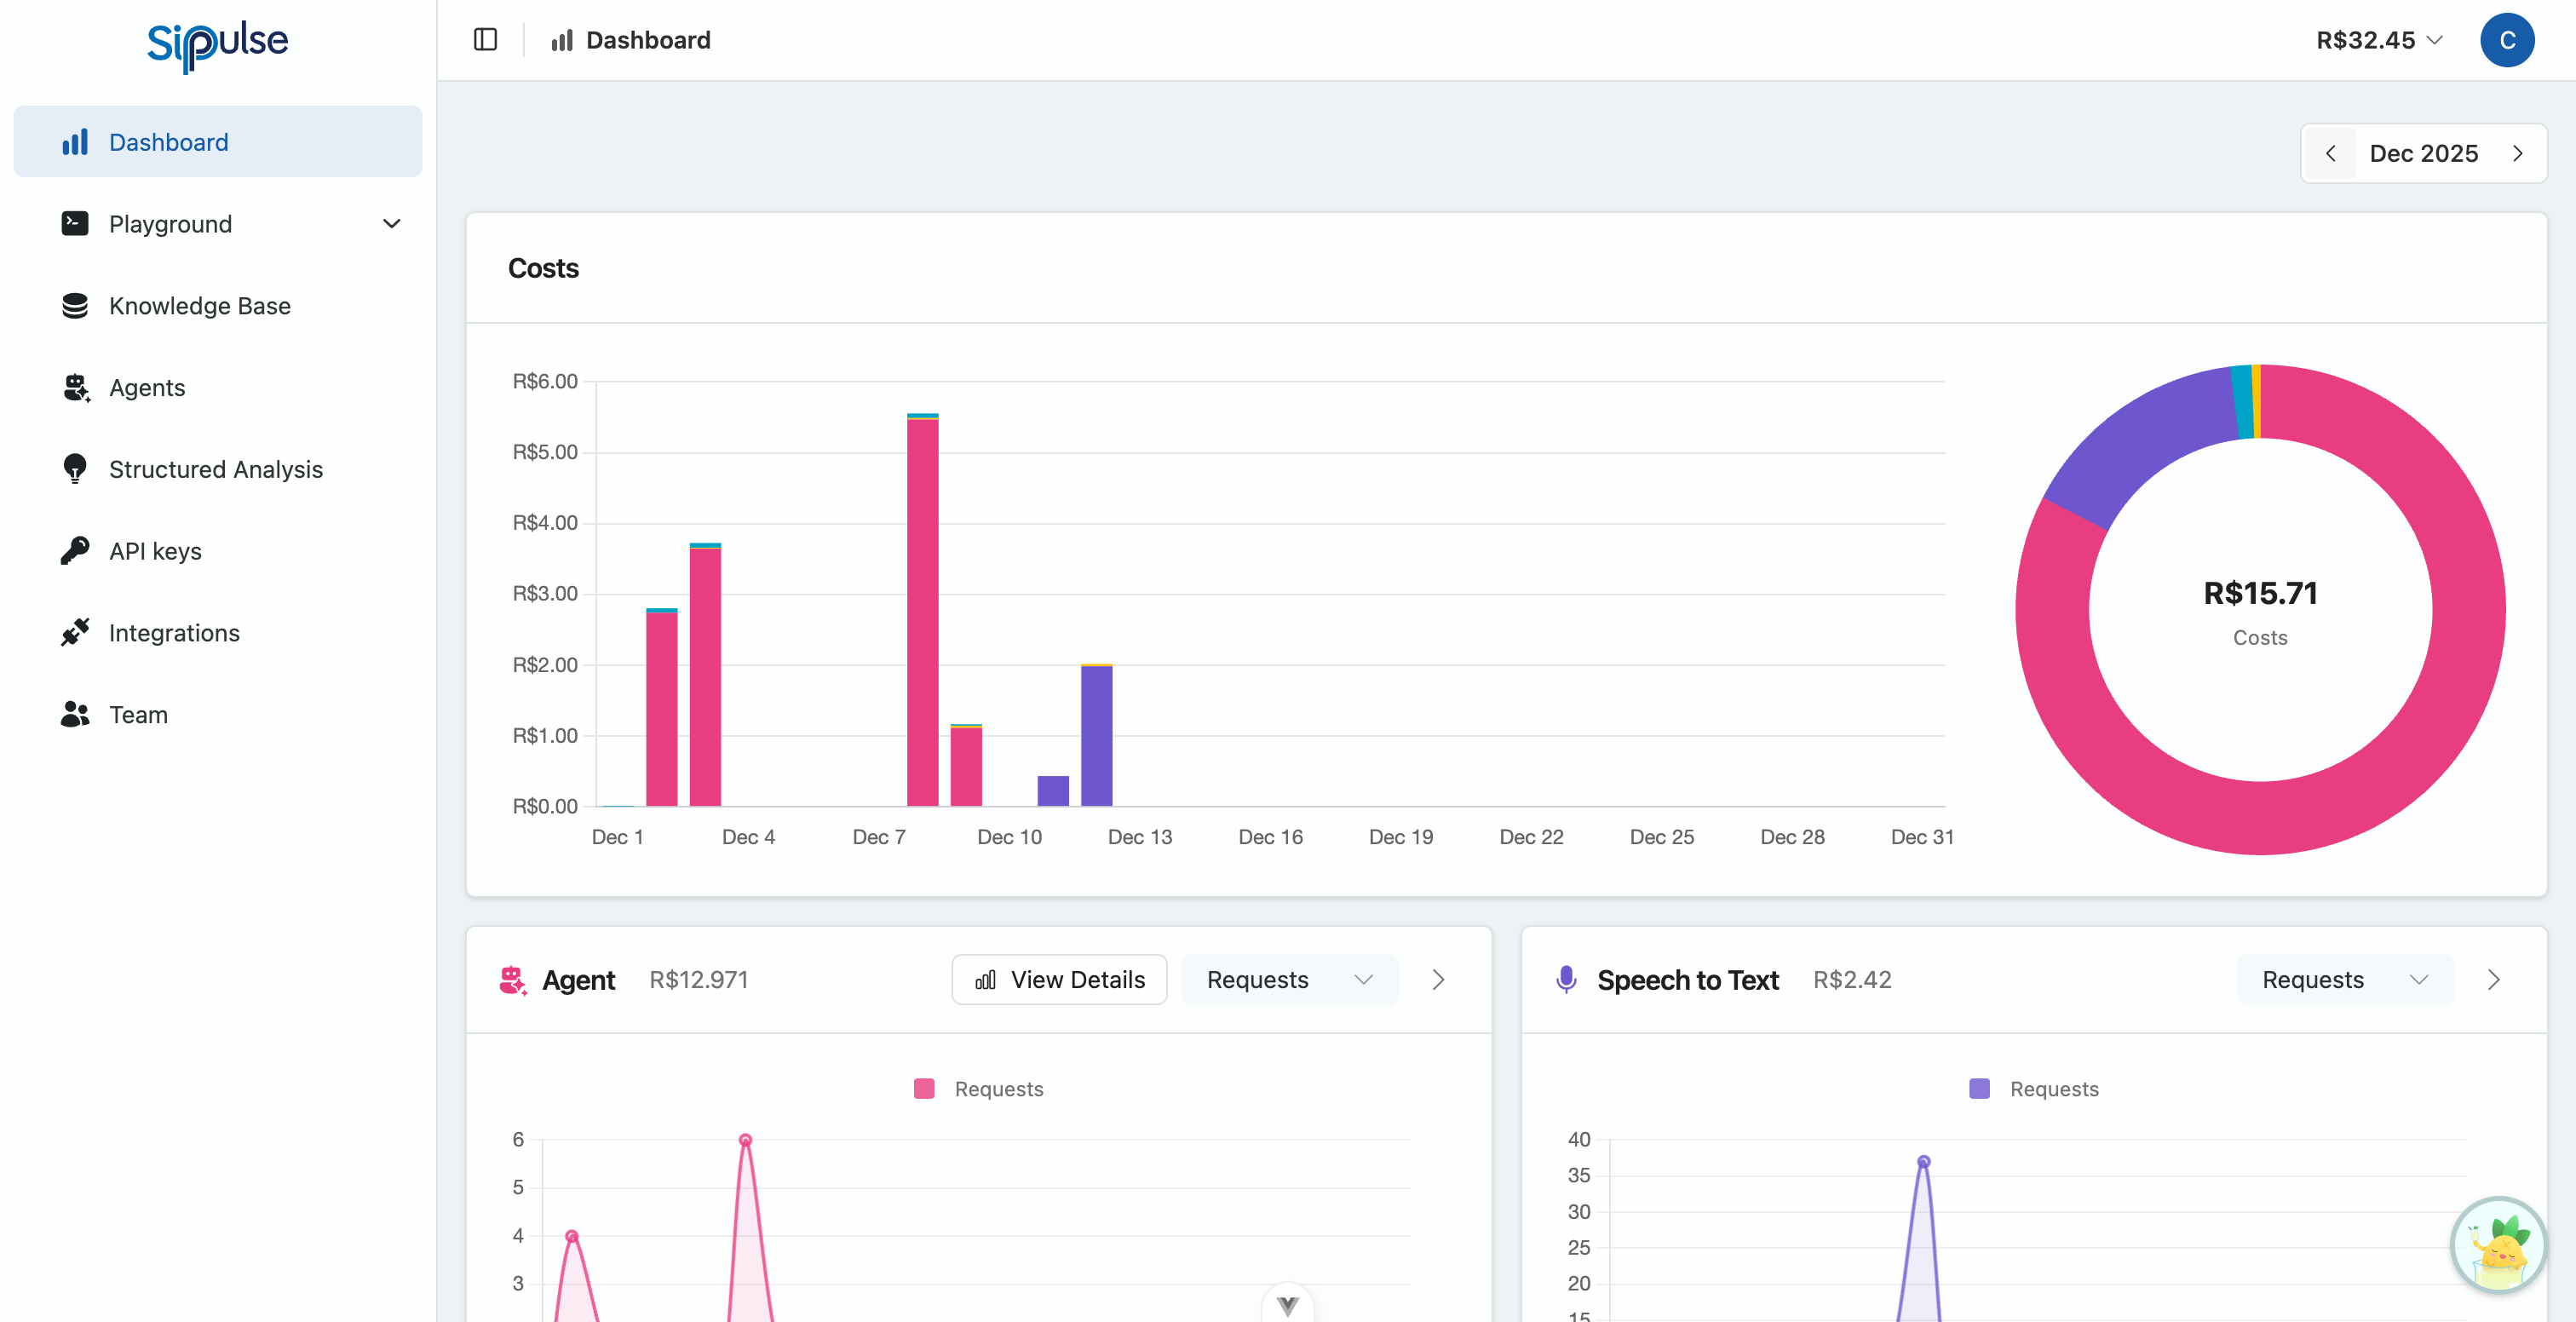
The Dashboard provides a comprehensive view of your AI services usage and costs. It enables you to monitor consumption patterns, analyze spending across different services, and export detailed usage data for reporting.
Understanding Usage Tracking
SipPulse AI tracks usage through a hierarchical model:
- Requests - Each API call represents a request. A request is the top-level unit of tracking.
- Items - Each request can contain multiple usage items. For example, a voice agent call may include items for speech-to-text, text generation, and text-to-speech.
This hierarchy allows you to see both high-level request activity and granular cost breakdowns per operation.
Period Selector
Use the period selector at the top of the dashboard to navigate between months:
- Click Previous month or Next month to change the viewing period
- The current month and year are displayed in the center
All costs and usage data shown below will reflect the selected period.
Costs Section
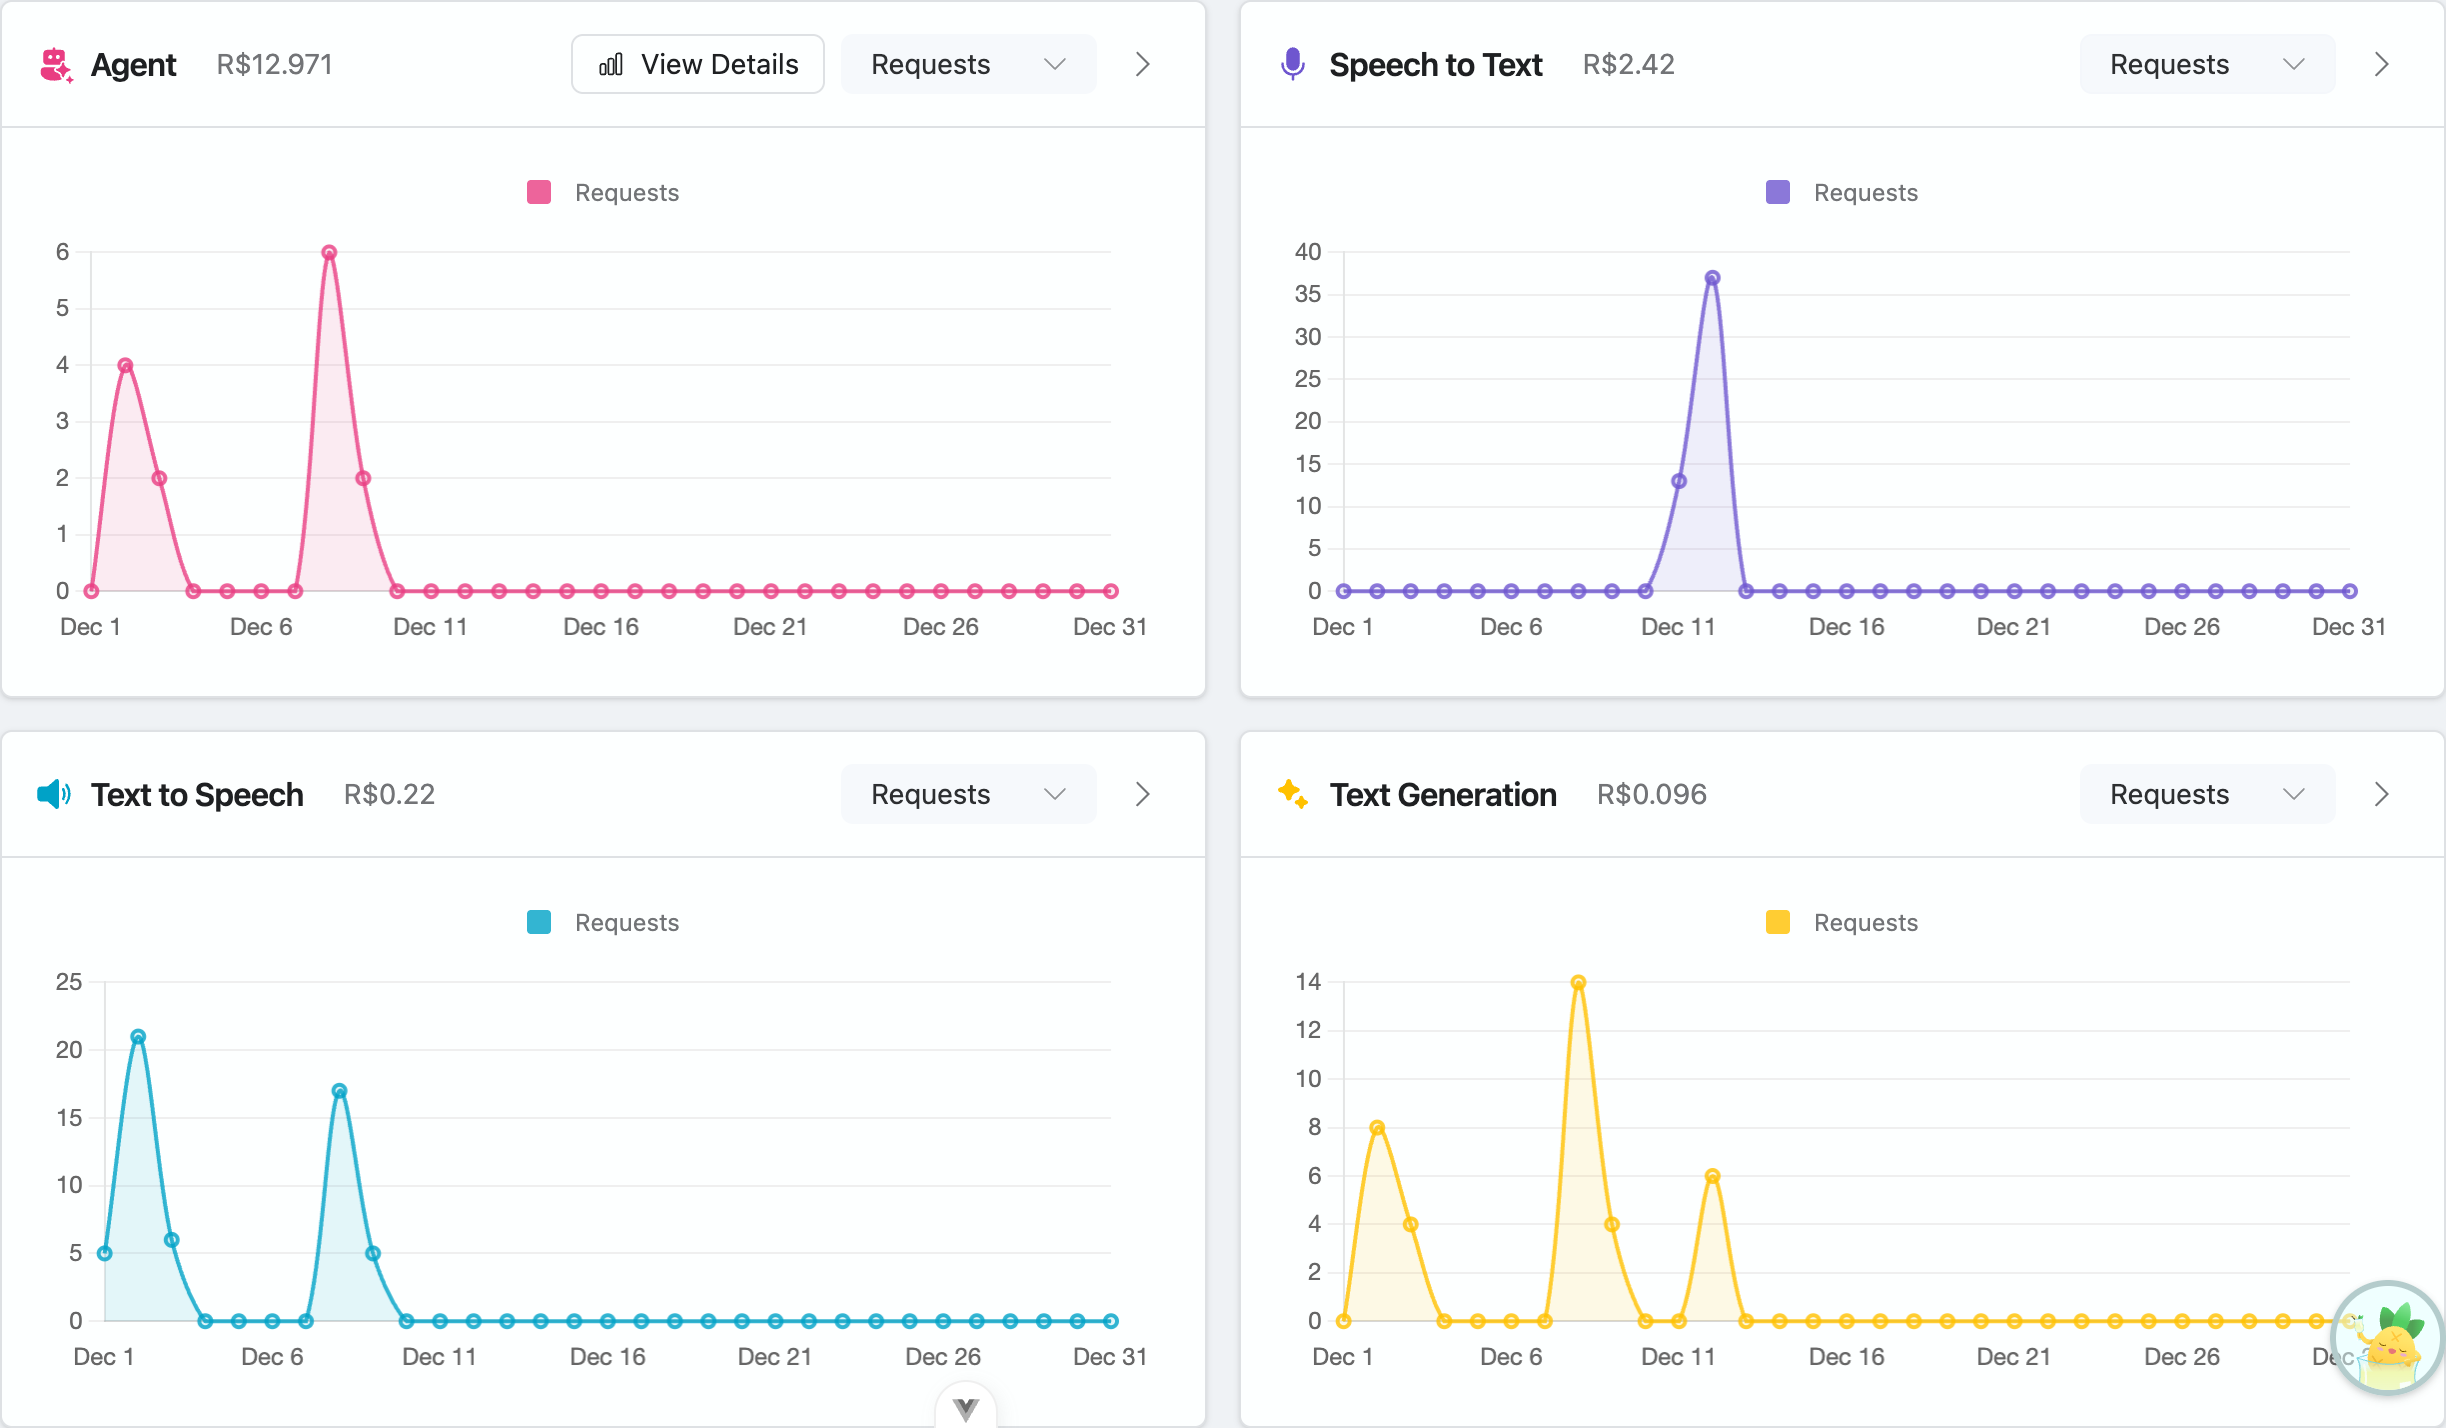
The Costs section displays your total spending broken down by service type. Each card shows:
| Service | Description |
|---|---|
| Agent | Platform fees for voice and chat agent interactions |
| Speech to Text | Transcription and speech recognition costs |
| Text to Speech | Voice synthesis and audio generation costs |
| Text Generation | LLM inference and text completion costs |
Important: Understanding Agent Costs
The Agent card shows only the platform fee (per output token for chat, per minute for voice). The underlying service costs (LLM, TTS, STT) appear in their respective cards.
To see the total cost of each agent (platform fee + all services combined), click View Details on the Agent card to access the Agent Analytics Dashboard.
Card Features
Each cost card provides:
- Total cost for the selected period
- View Details link to access detailed breakdowns
- Metric selector to toggle between different metrics (e.g., Requests)
Agent Costs Dashboard
Click View Details on the Agent card to access the dedicated Agent costs dashboard:
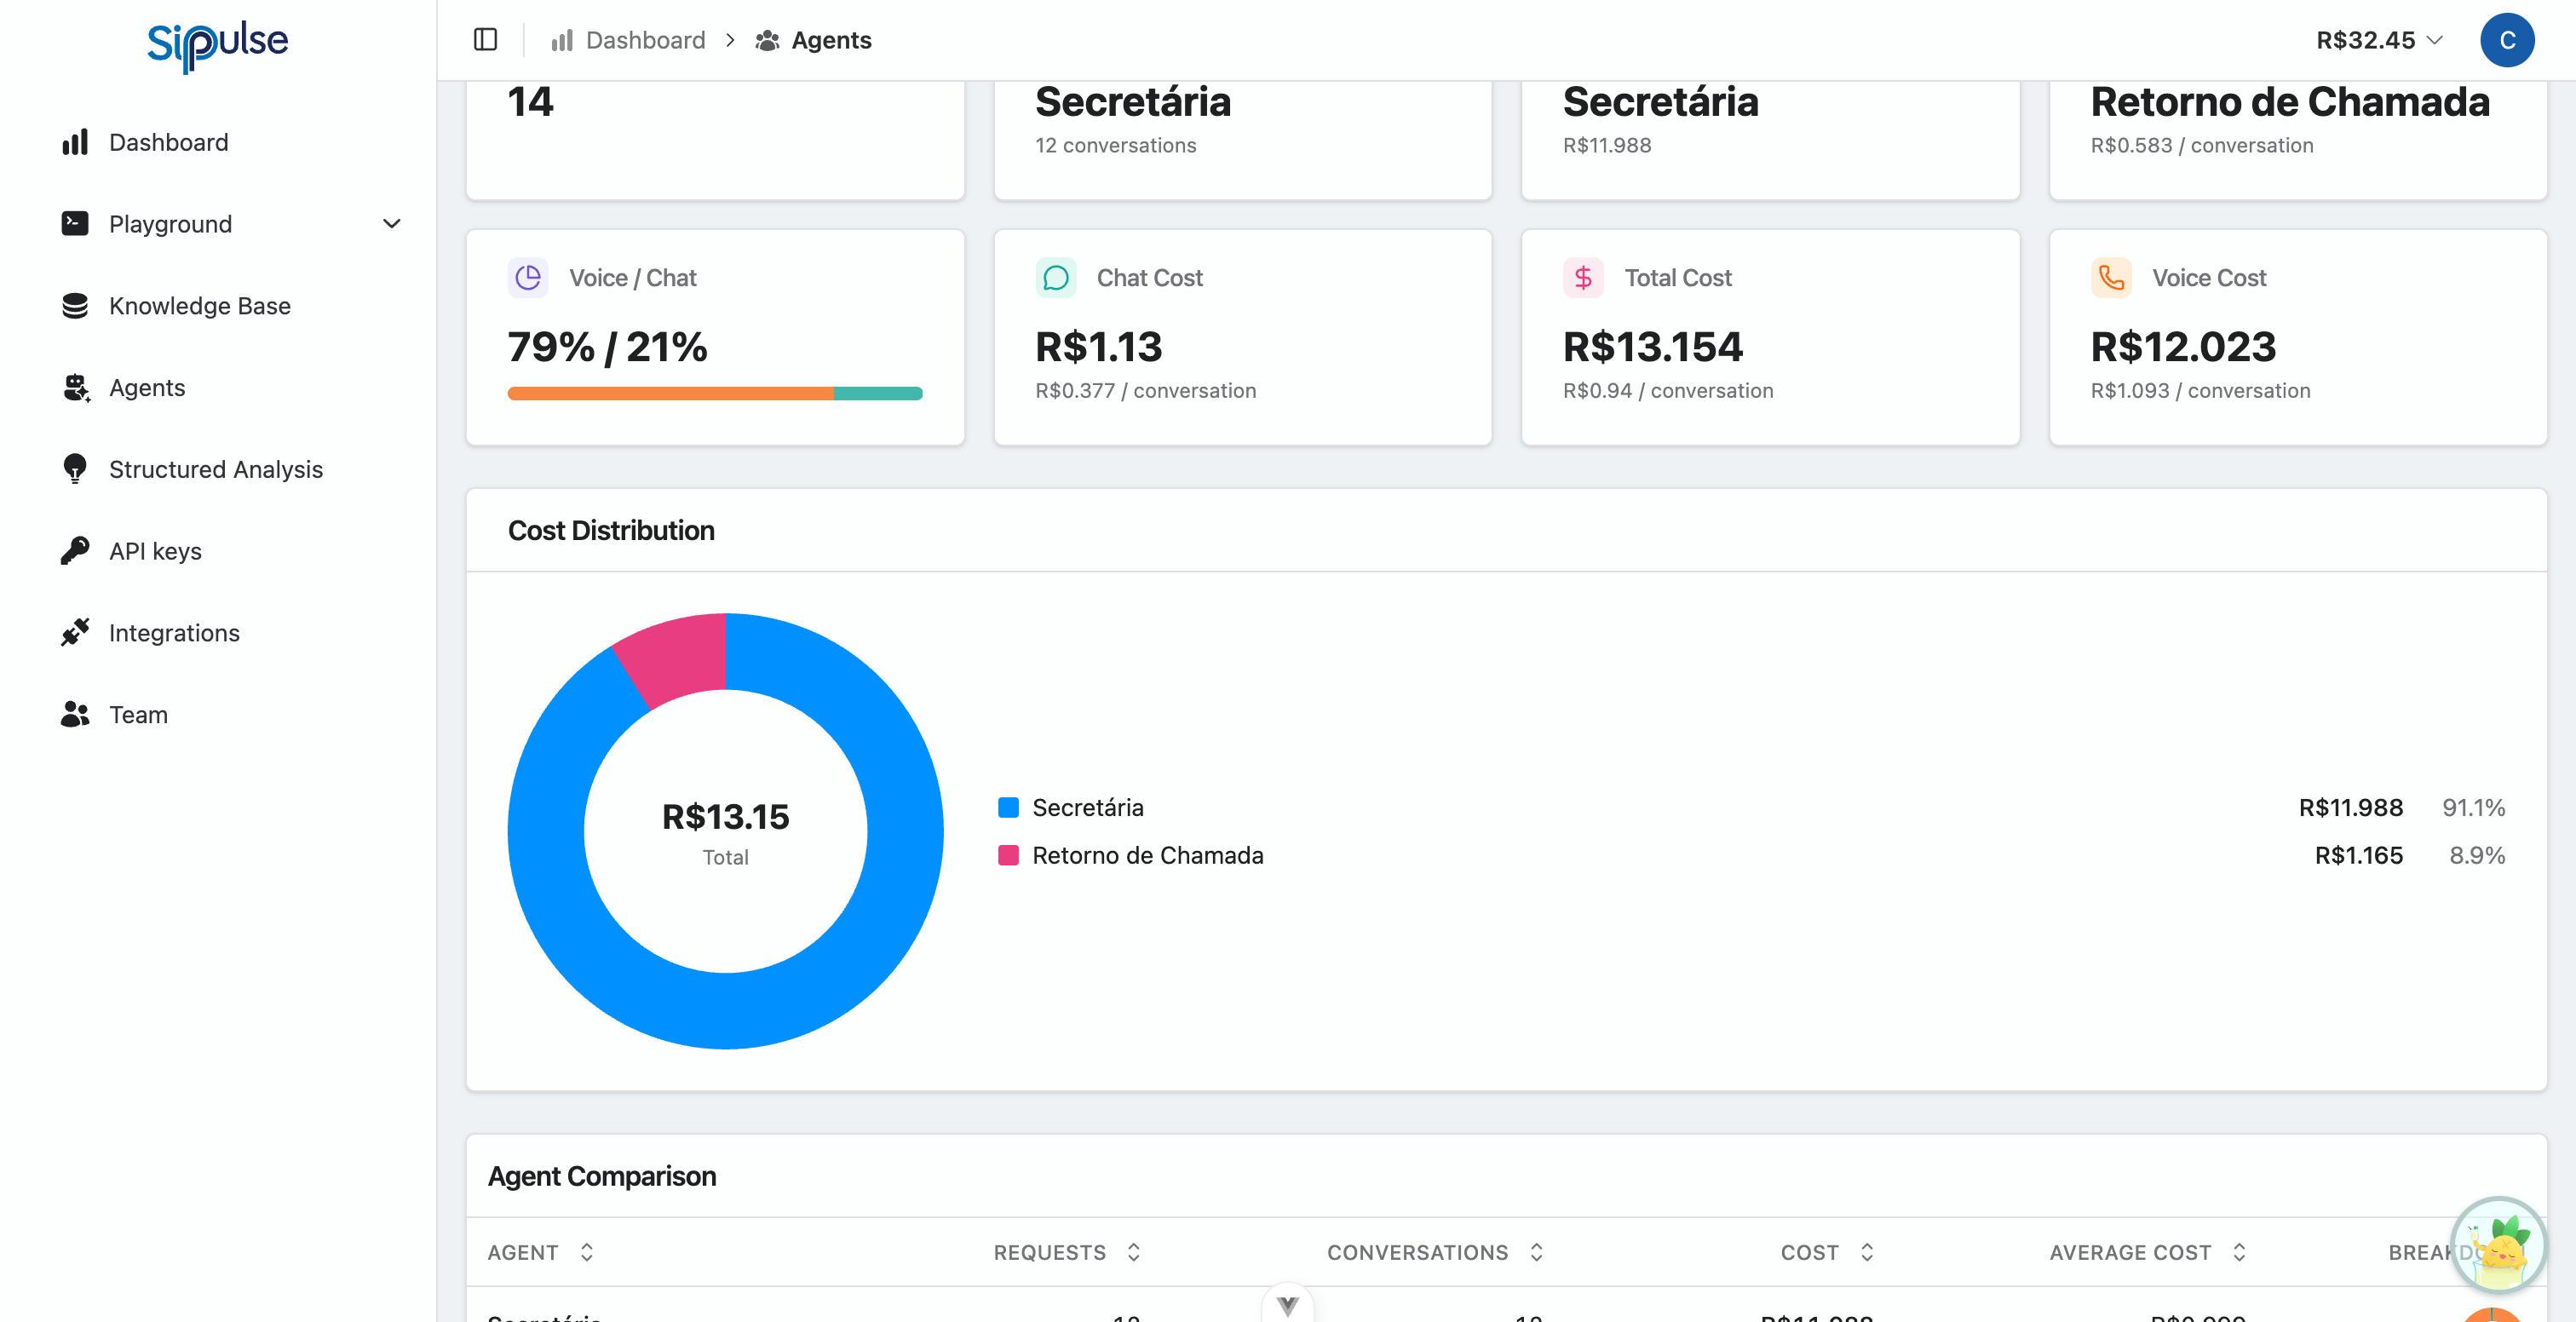
This view provides:
- Summary metrics - Total agent costs and request counts
- Cost distribution - Breakdown by agent
- Agent comparison table - Compare usage across all your agents
Usage Requests
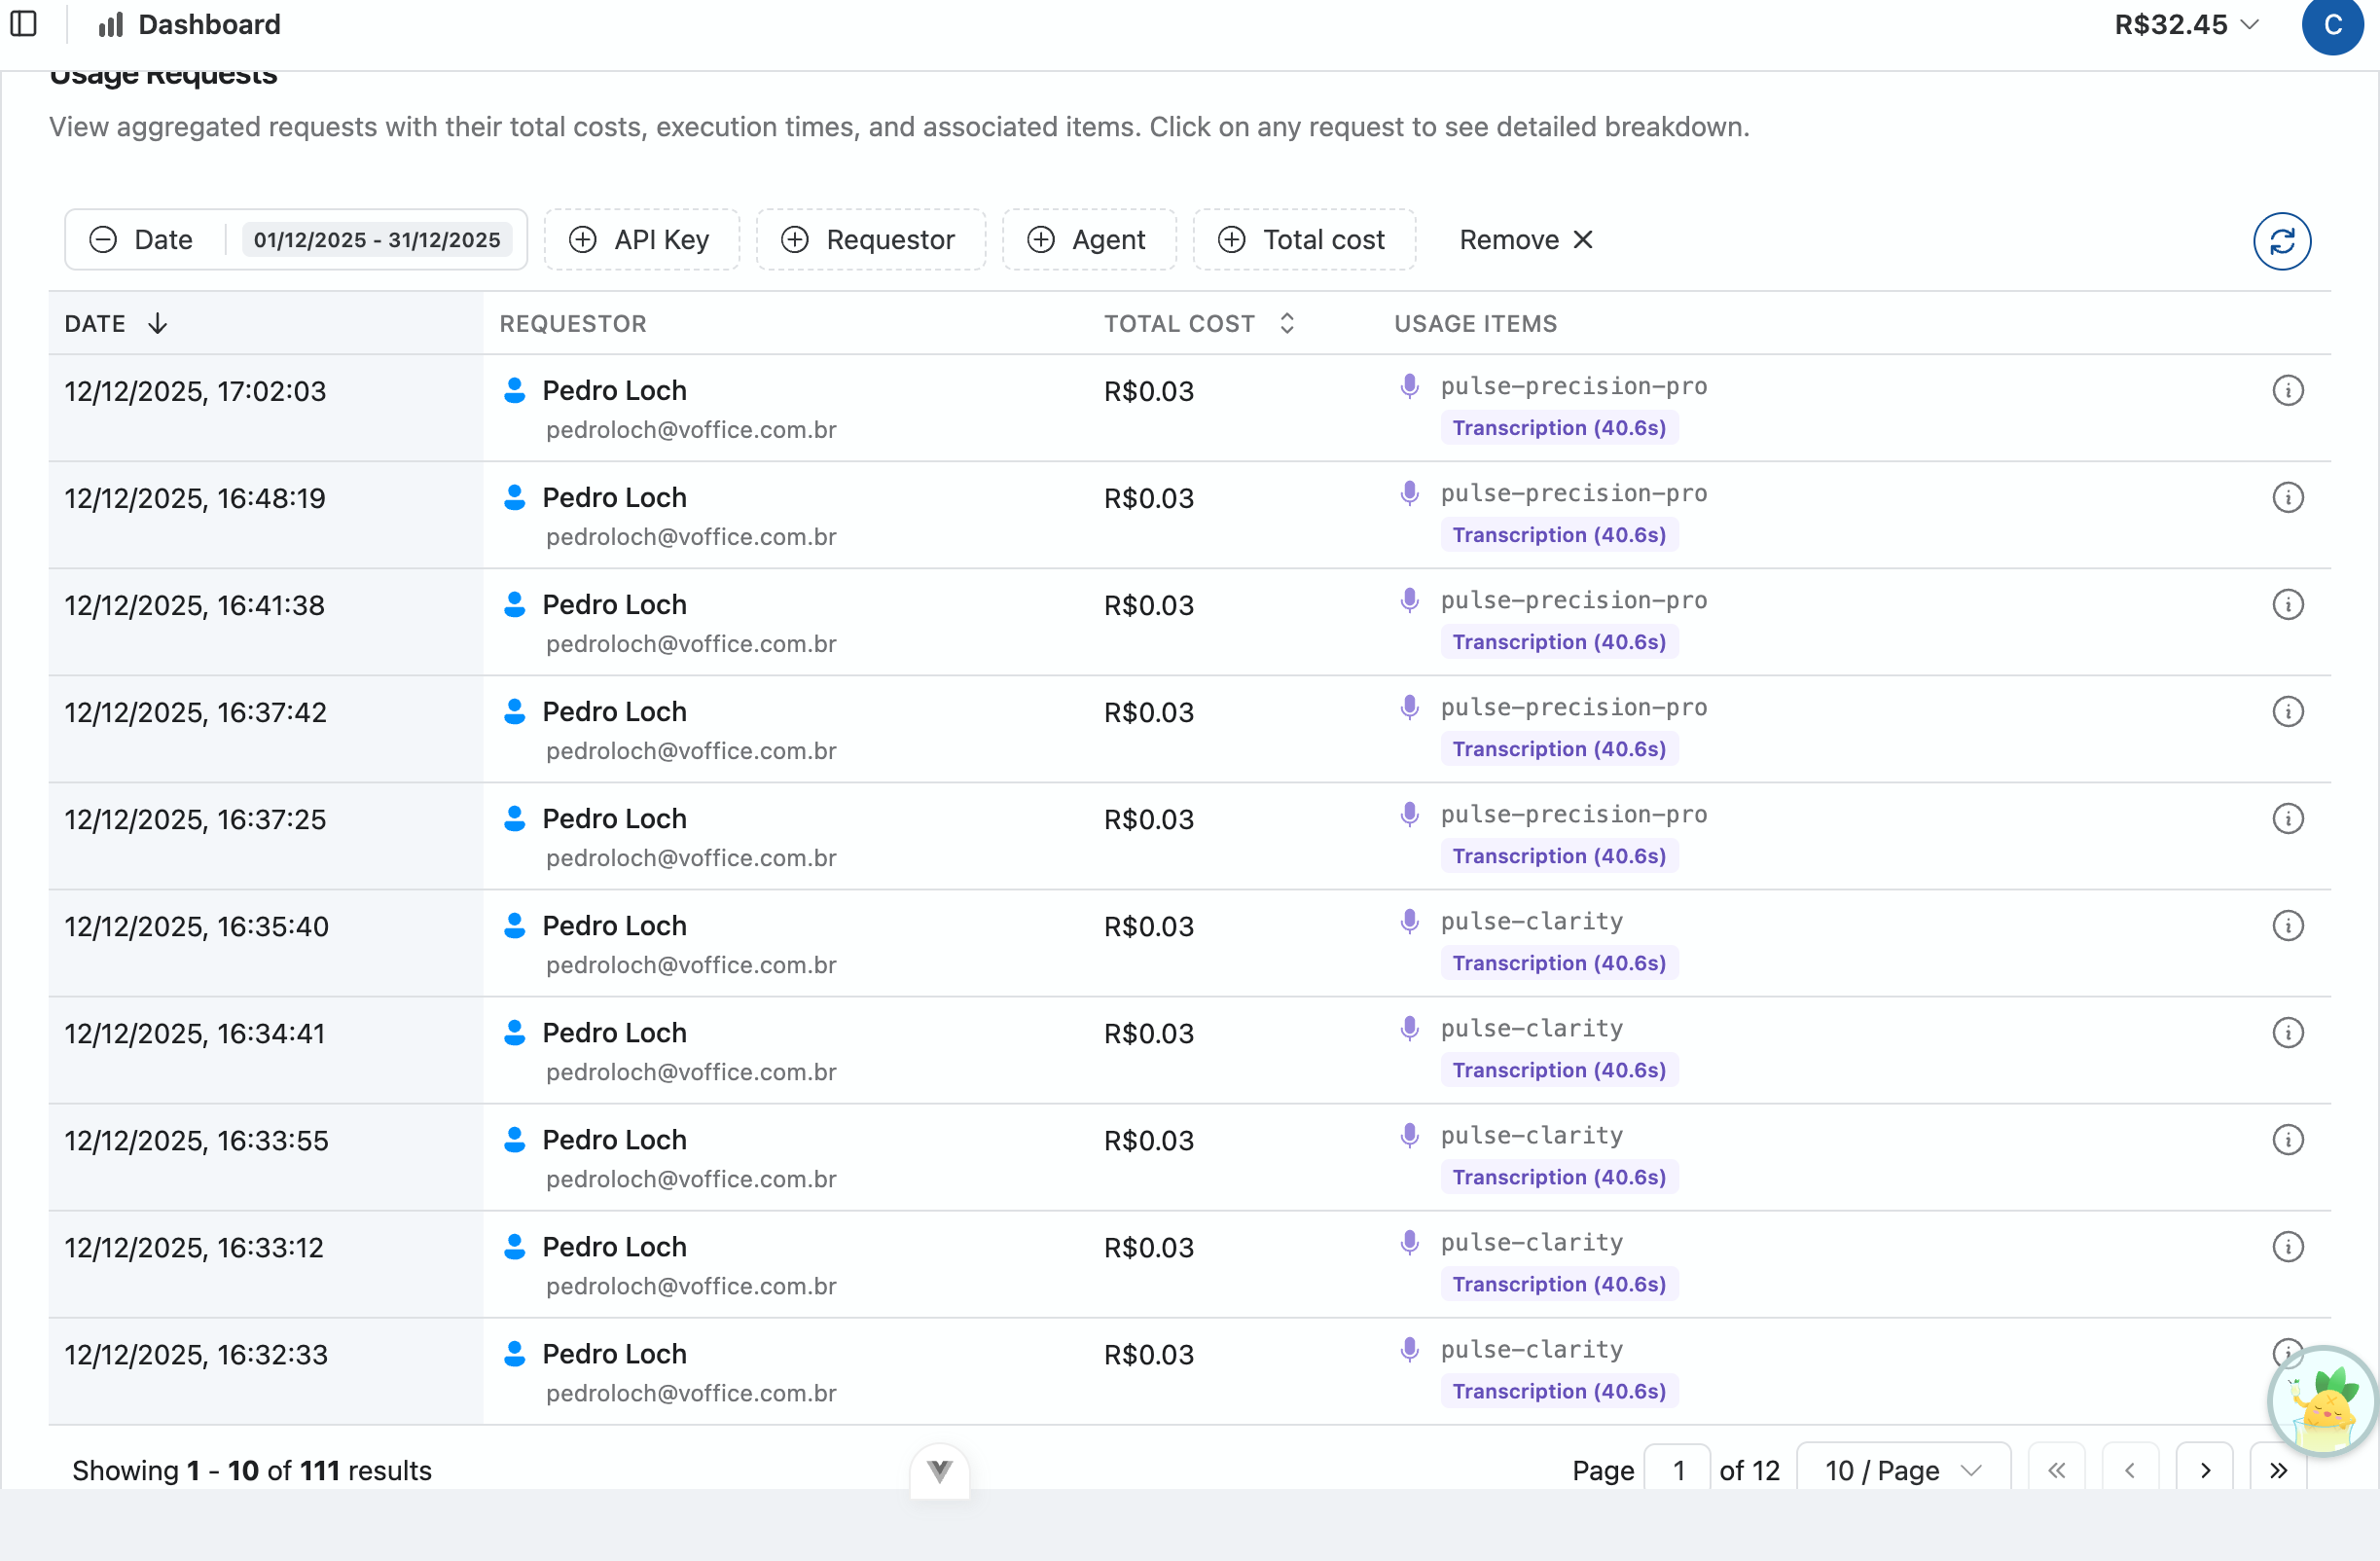
The Usage Requests table displays aggregated requests with their total costs. This view helps you understand request patterns and identify high-cost operations.
Table Columns
| Column | Description |
|---|---|
| Date | When the request was made |
| Requestor | The user or system that initiated the request |
| Total cost | Combined cost of all items in the request |
| Usage Items | Summary of items included (e.g., model used, operation type) |
Filtering Requests
Use the filter buttons above the table to narrow down results:
- Date - Select a specific date range
- API Key - Filter by the API key used
- Requestor - Filter by user or email
- Agent - Filter by specific agent
- Total cost - Filter by cost range
Click Refresh to update the table with the latest data.
Viewing Request Details
Click the expand button on any row to see the full breakdown of usage items within that request.
Usage Items
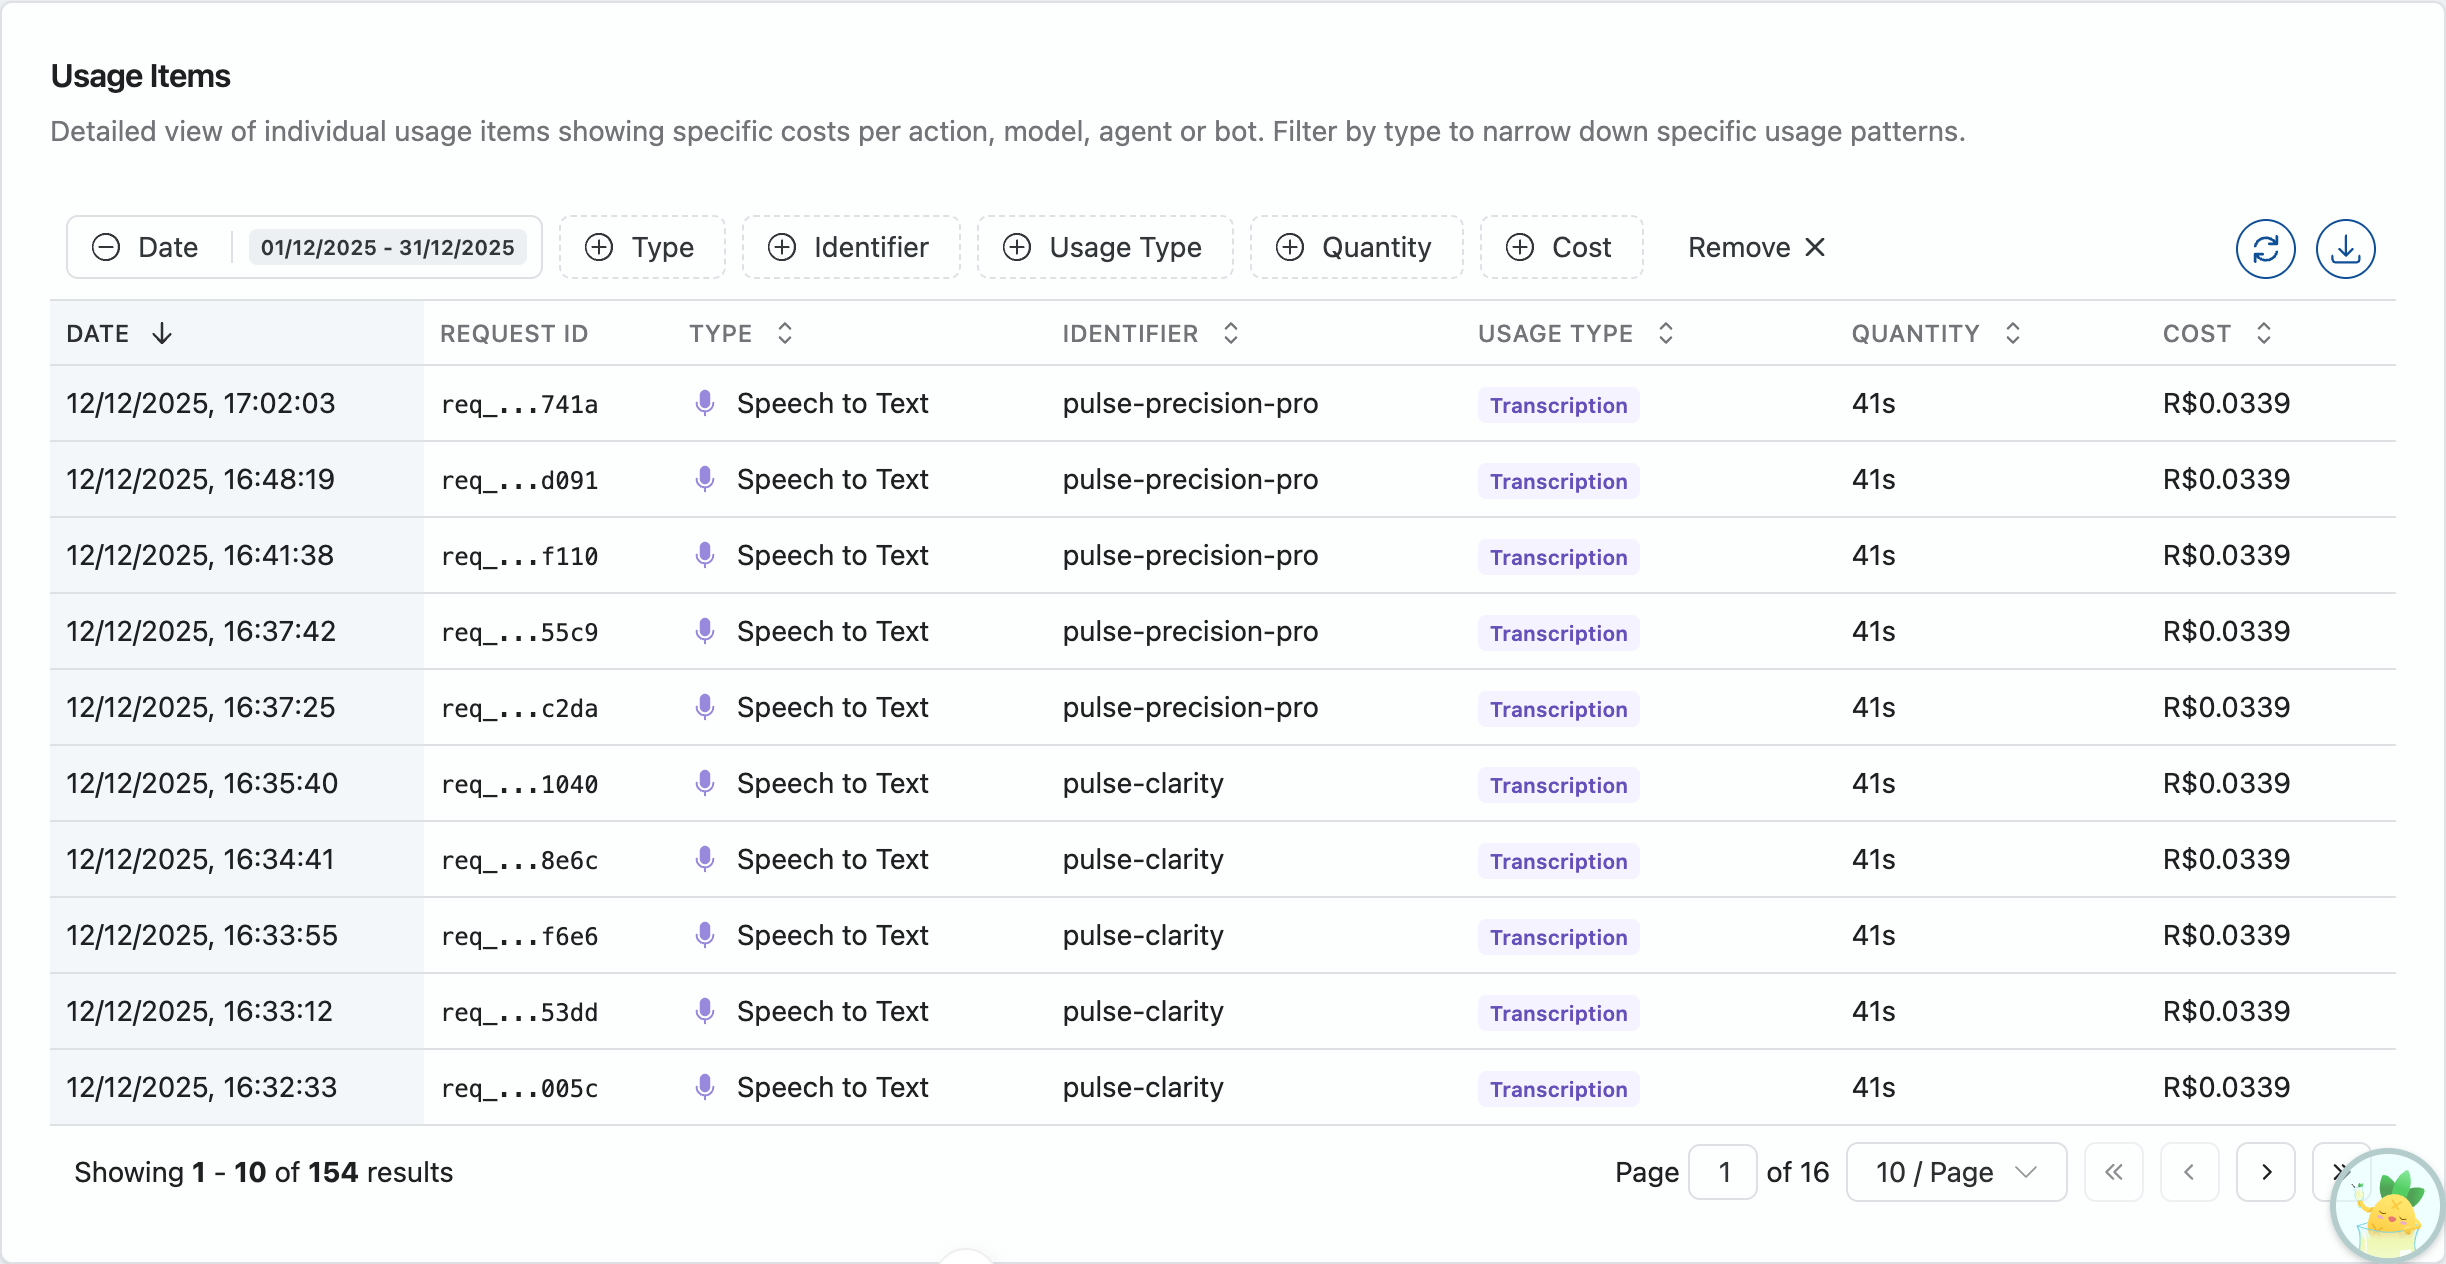
The Usage Items table provides granular visibility into individual operations. Each row represents a single billable action.
Table Columns
| Column | Description |
|---|---|
| Date | When the operation occurred |
| Request ID | Parent request identifier |
| Type | Service category (Speech to Text, Text to Speech, etc.) |
| Identifier | Model or service name used |
| Usage Type | Specific operation (e.g., Transcription) |
| Quantity | Amount consumed (seconds, tokens, etc.) |
| Cost | Cost for this specific item |
Filtering Items
Use the filter buttons to focus on specific data:
- Date - Select a date range
- Type - Filter by service type
- Identifier - Filter by model or service name
- Usage Type - Filter by operation type
- Quantity - Filter by consumption amount
- Cost - Filter by cost range
Exporting Data
Export your usage data for external analysis or reporting:
- Click the Export button (download icon) above the table
- Choose your preferred format:
- CSV - Spreadsheet-compatible format
- JSON - Structured data format
- The export includes all data matching your current filters
Export Tip
Apply filters before exporting to get exactly the data you need. This helps create focused reports for specific time periods, services, or cost ranges.
Pagination
Both tables support pagination for navigating large datasets:
- Page indicator shows current page and total pages
- Items per page selector lets you choose how many rows to display (10, 25, 50, 100)
- Navigation buttons allow jumping to first, previous, next, or last page
Best Practices
Cost Monitoring
- Review weekly - Check the dashboard regularly to catch unexpected usage spikes
- Compare periods - Use the month selector to compare usage across periods
- Track by service - Monitor which services consume the most resources
Usage Analysis
- Use filters - Narrow down data to find specific patterns
- Export regularly - Create periodic reports for budgeting and planning
- Monitor agents - Use the Agent dashboard to optimize voice agent performance
Cost Optimization
- Identify high-cost items - Filter by cost to find expensive operations
- Review request patterns - Look for redundant or inefficient API calls
- Optimize agent configurations - Adjust voice agents based on cost data
